88 Comics Categorized "Step #5 – Show me the data! My conclusion is …" (page 2 of 5)

Now that you have attempted/achieved ‘flying’ with your psychological practice, it’s time to show us a stick figure scene of your evidence-based conclusions. What do your 14 days of data — dependent measures (e.g., happiness, productivity, energy) — reveal about the effectiveness of your psychological practice. Note: you may include a cartoon sketch of the graph of your data. You will also submit an APA style graph of your data with your full report.

A stick fig person is looking at a presented data on a screen, and he is seemingly happy about it

STEP #5 SHOW ME THE DATA! MY CONCLUSION IS

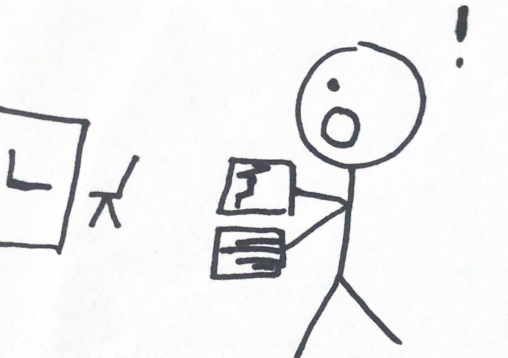
I am looking at a data of my wellness practice which I performed, and I am very happy with the results of my wellness practice. I now use…

Stick person is sadden by looking at the data

Step 5 show the data!

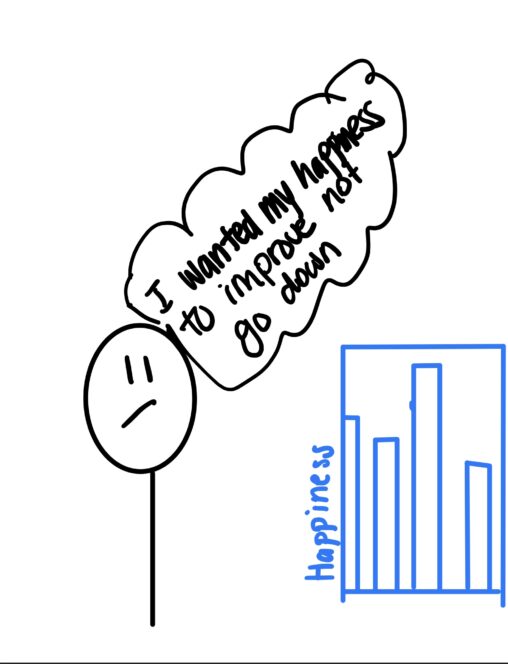
The stick person is looking at its data and is extremely disappointed because they expected their happiness to increase over the 2 week study not decrease.

The stick figure in this image is seated in front of the laptop with a pleasant smile on its face. The individual appears to be confident after reaching the wellness project\'s aim. The two arrows represent the progression of the stick figers 14-day study project outcomes. The red arrow denotes anxiety, whereas the green arrow denotes happiness.

“Step #5 – Show me the data! My data entry and analysis “

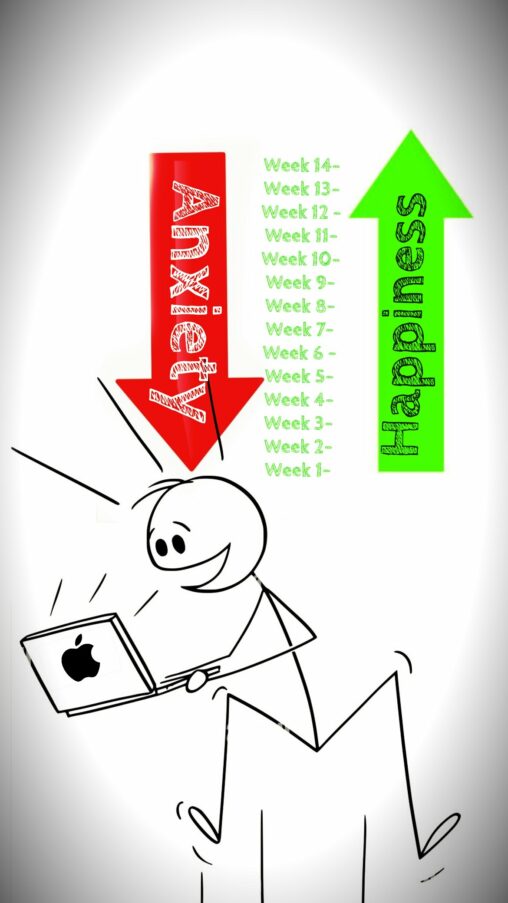
As someone who suffers from an anxiety condition, this trip has assisted me in developing a healthy coping approach to handle my unbalanced life. After completing the wellness…

Stick figure version of me, examining my statistical outcomes.

Step #5 – Show me the data!

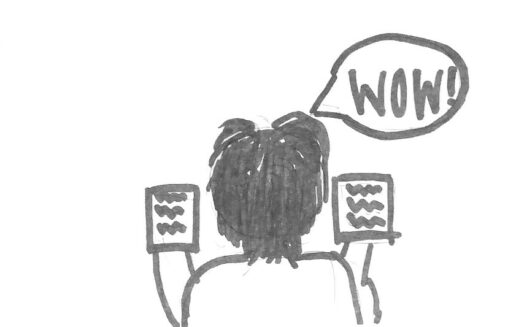
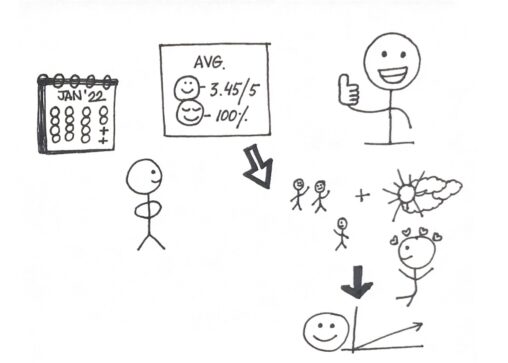
After having completed my vigorous 14-day study, I am impressed with my outcome. Through analyzing and evaluating my sheets of data, I a proud of the results I…

A person examining their two graphs and being surprised by the data. Theres a desk with a laptop in the back along with a chair at the desk

STEP #5 data entry and analysis

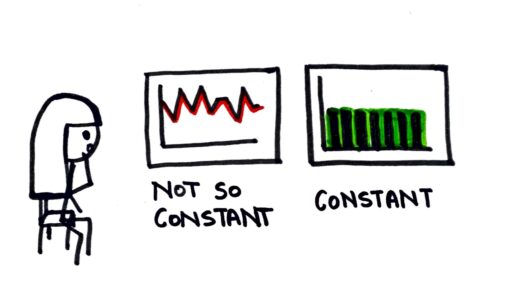
I was surprised to learn that I was more consistent with my wellness practice than I had originally predicted, but with the other graph my estimate was quite…

The stick figure person looking at the result of its 14 days wellness practice.

Show me the data ! My conclusion

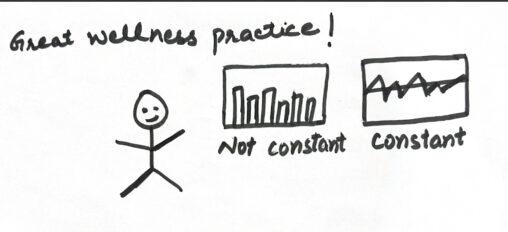
Upon seeing the result I got to know that it’s a great wellness practice.by doing this practice I learned to remain happy , determined and how to control…

A figure on a skateboard rides the average line of a line graph. The line is very gradual and the figure looks disappointed.

STEP #5 – SHOW ME THE DATA! MY CONCLUSION IS…

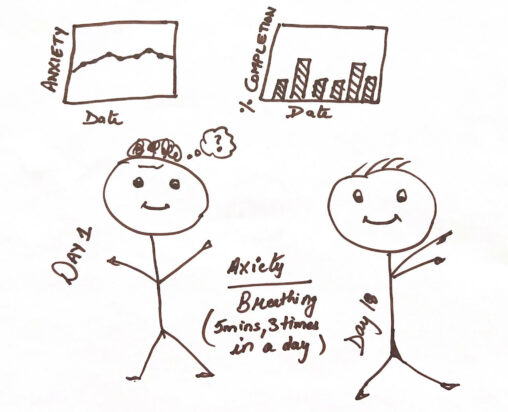
When I first calculated my average anxiety levels after turning my phone off for two hours almost every day for 14 days, I was disappointed to see there…

Girl does a yoga for 10 minutes; graph shows slight anxiety decrease. Girl does a yoga for 40 minutes; graph shows significant anxiety decrease.

STEP #5 – SHOW ME THE DATA!

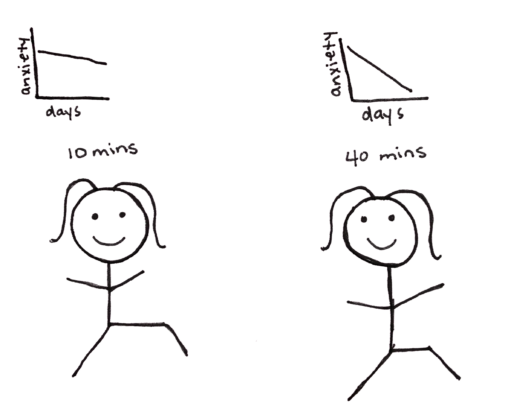
My comic shows a scene of me doing yoga for 10 minutes and my anxiety levels decreasing slightly. Next to that there is a scene of me doing…

Person sitting on chair observing the two graphs in front of her.

Step #5 – Show me the data

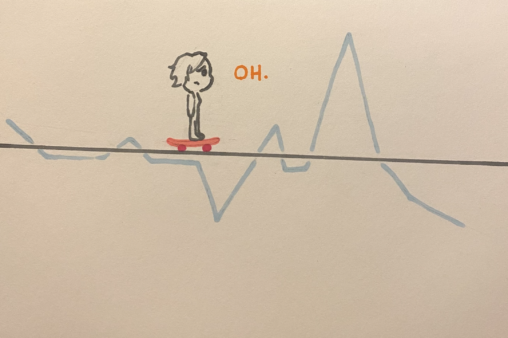
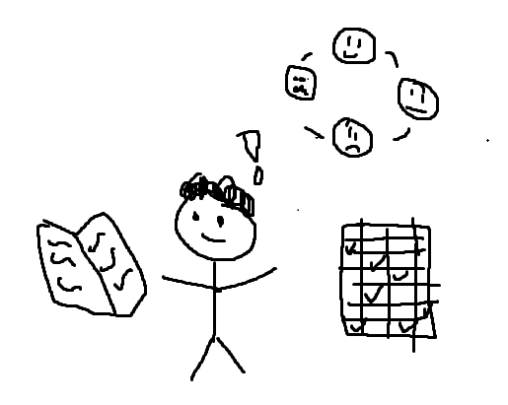
After completing this 14 day activity, I looked at the results and was surprised to see how my mood kept changing throughout the day. However, I was relieved…

Anna drawn as a stick figure is sitting in a chair with her back shown looking up at six monitors. Each monitor contains different information such as a bar graph, a pie chart, a line graph and a stacked line graph.

Step #5 – Show me the data! My conclusion is …

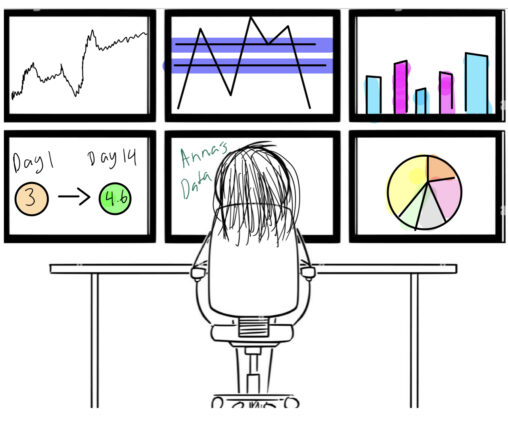
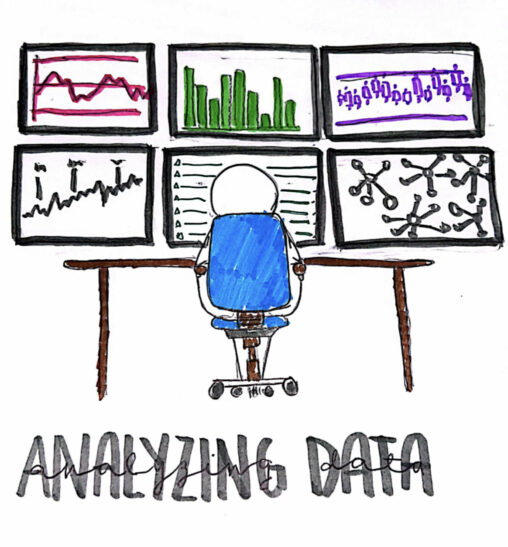
To conclude my “get cape wear cape” project I am sitting in front of a desk staring at six monitors that contain data about my findings as I…

A stick person had happiness on her face as she would like to exercise. Her happiness disappeared on her face when she was running later.

Step #5 – Show Data

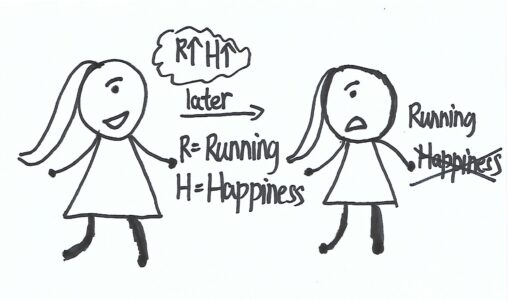
In my comic, I was extremely happy when I ran outside since I would like to lose my weight. In contrast, my happiness has disappeared when I ran…

There is a graph trending upwards, a person doing yoga in the sun and a March calendar with check marks

Step #5 Show me the data!

I realized doing my daily wellness practice, yoga, that although the upwards trend was very slight it was still an increase. I have decided to continue my doing…

There is collected data shown shown in two different graphs of wellness practice to reduce the anxiety. The first stick figure person visualizes me confused because of anxiety. After doing the wellness practice which was breathing for 5 minutes three times a day for 18 days did not make remarkable difference in my anxiety level may be because I did not choose effective practice. But I\'m still feeling little better as compare to earlier condition.

Step #5 – Show me the Data!

The comic depicts a graph of recorded data for 18 days and the stick figures are showing the difference in mood over time.

Line graph and bar graph on the wall, stick person looking at the graphs, red book inside a thought bubble.

Step #5 – Show Me the Data!

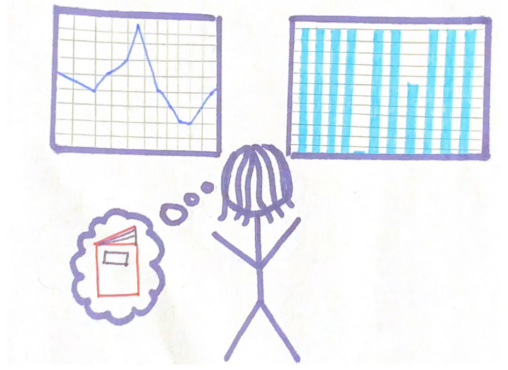
My 14-day research project went very well. After reviewing my data, I learned that reading did influence my anxiety in a positive way. However, it only reduced my…

Line graph showing average daily happiness and a stick figure standing confused about the result

STEP #5 SHOW ME THE DATA

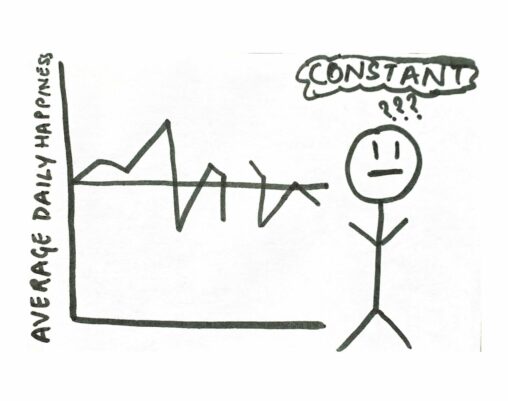
This comic shows my conclusion from the get cape project, where my average daily happiness came out to be constant. My get cape journey was full of ups…

The same stick figure is depicted 5 times above horizontal jagged line that becomes smooth and timeline

Step5 My Conclusion

This scene shows my conclusion, which is that over a (much) longer period of time, I do think that the practice of mindfulness meditation could help me to…

The stick figure is revealing that after doing this wellness practice for 14days, how it has bought calmness and happiness in my life.

Step 5

In the above comic, the stick figure is very calm and happy and I believe this is the affect of meditation that’s been done for the past 14days!…

A person kneeling, a person climbing a staircase, a person on a flagpole and a red arrow line.

Step #5- Show Me The Data!

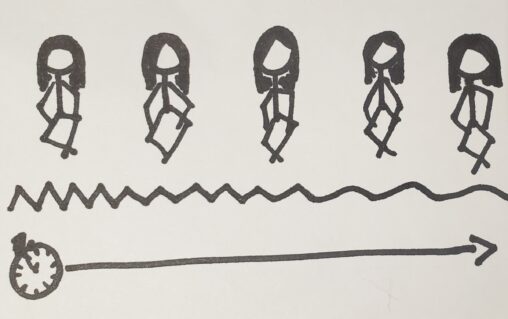
The person started looking defeated and discouraged. This was me when I started the research project because I was feeling unmotivated and I just had all this negative…

stick figure feeling great after doing the Get Cape Project and viewing her average scores

Step #5 Show me the data

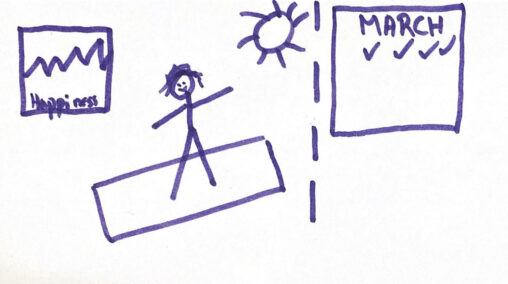
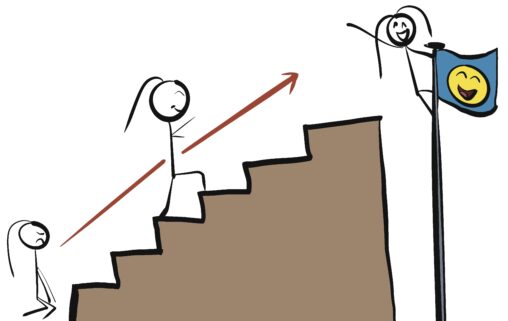
The stick figure is feeling great after accomplishing the task for Get Cape Project for not just 14 days but for more than a month, i.e., 36 days….

There is a guy looking at data with a excalmation point on his head showing that he is confused. There is also faces one being neutral the other happy sad and confused showing it has been a lot of different emotions throughout the journey. And a check mark list showing checkmarks and indicating data collection,

Step #5 – get cape share my data and explain how it felt

Throughout my get cape journey i learned a lot about myself and the important of sleep. it was quite exciting to see how my body reacted overtime to…