
88 Comics Categorized "Step #5 – Show me the data! My conclusion is …" (page 3 of 5)
Now that you have attempted/achieved ‘flying’ with your psychological practice, it’s time to show us a stick figure scene of your evidence-based conclusions. What do your 14 days of data — dependent measures (e.g., happiness, productivity, energy) — reveal about the effectiveness of your psychological practice. Note: you may include a cartoon sketch of the graph of your data. You will also submit an APA style graph of your data with your full report.
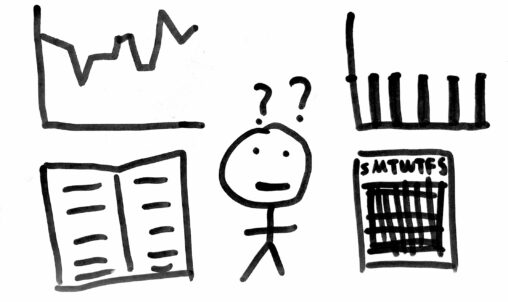
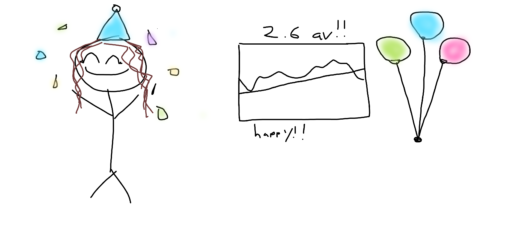
After the 14 days of practice, I am looking at the graphs I got from my data. I have my notes and calendar to refer to. I am…
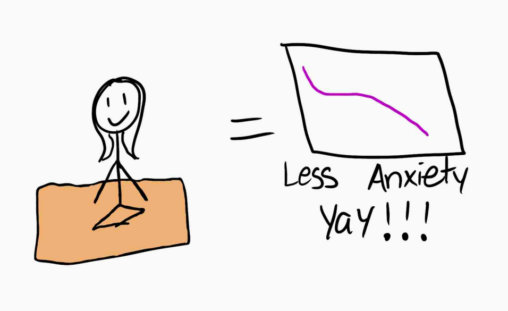
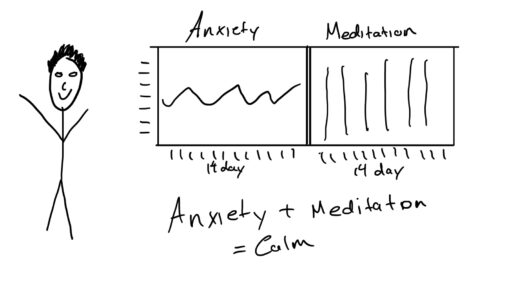
In this comic I show how my meditation resulted in my graph being extremely positive. Through this study I saw a huge improvement in my anxiety as it…
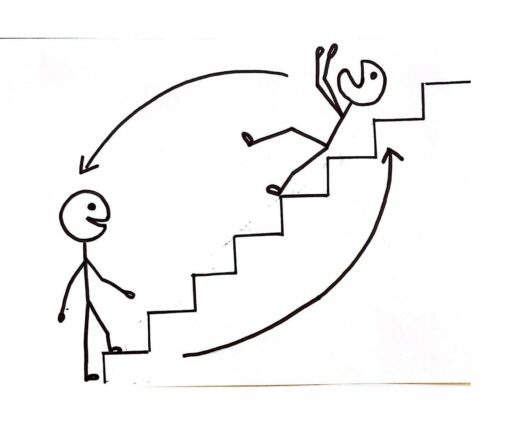
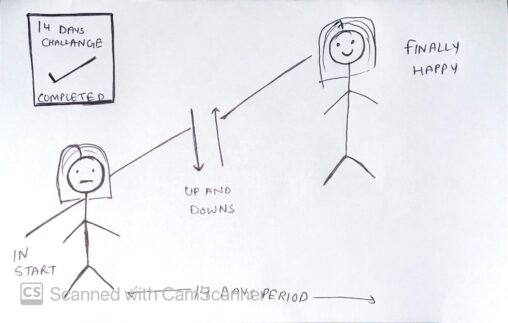
I am proud to complete Get Cape project, even though sometime it felt very challenging. And it seemed like I was not doing progress, but keep practicing pushed…
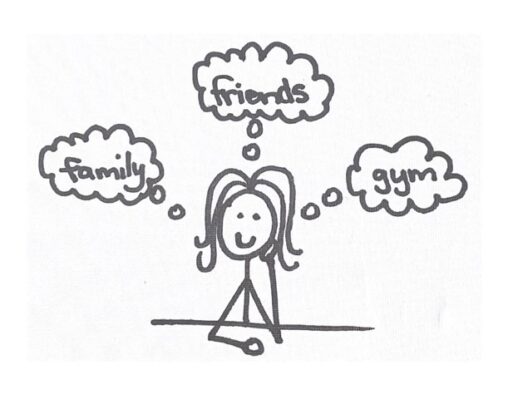
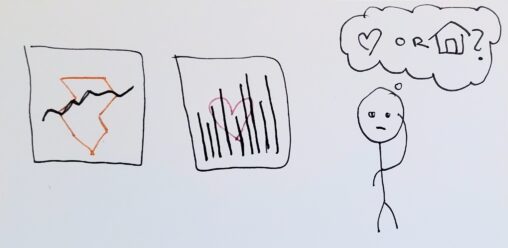
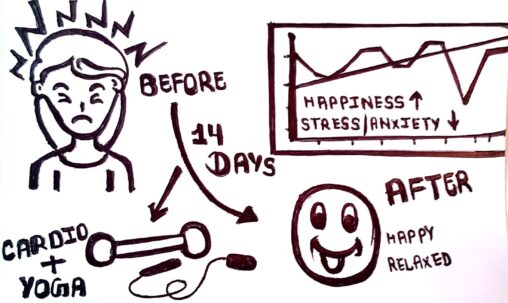
To conclude my results I realized that working out and going to the gym plays a factor in my happiness but so is other things in my life…
From my get cape research project, I’ve learnt so much. Doing mediation for 14days was absolutely amazing. I continued it after that also. I’ve concluded that my actual…
As I look at my data regarding my wellness practice, i find many inner realizations regarding my journey and what all of what I had done over 14…
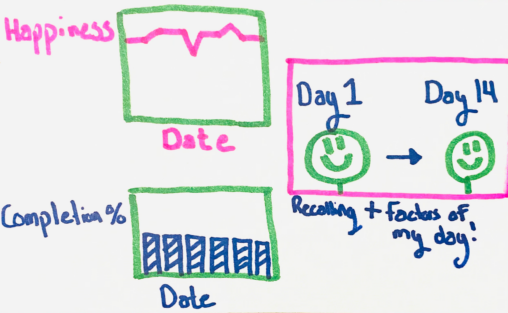
After 14 days of my wellness practice, there was no significant change in my happiness. The results indicate that I was able to maintain steady happiness throughout the…
From my project, I learned that practicing loving-kindness meditation correlated with increased energy. However, there may have been confounding variables such as my reading break or personal life…
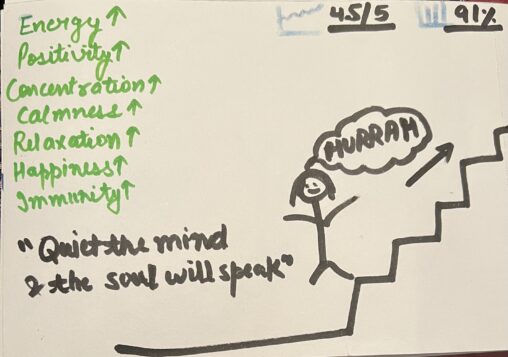
I am happy after completing my get cape project as I had learned a lot of things. I had developed the positivity in my mind. The peak of…
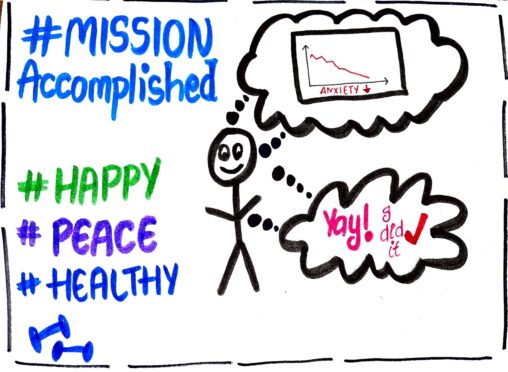
So, finally my study is done and I am so happy that I finished it on a good note, Honestly I was not expecting such good results, It…
After going over all the data and reading the graphs I realized that meditation did help with anxiety, but the results for me were not super different for…
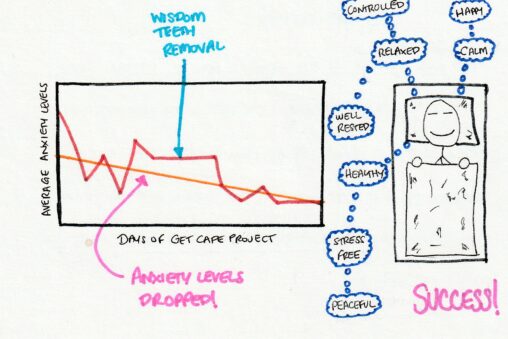
After over 14 days of my wellness project, I feel I have controlled my anxiety levels to the best of my ability. Giving myself scheduled breaks away from…
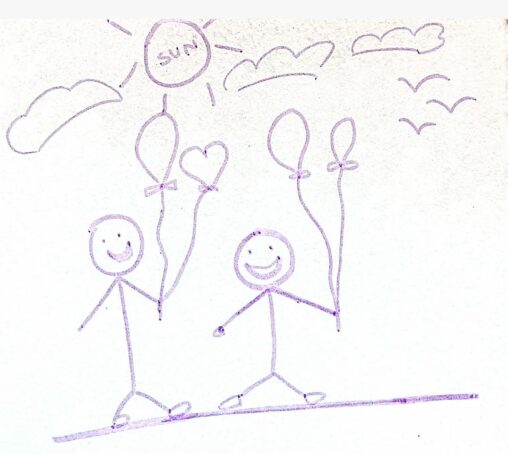
Here we have me celebrating my new and improved outlook! Lots to be positive about! Even though life got in the way and gave me a bit of…
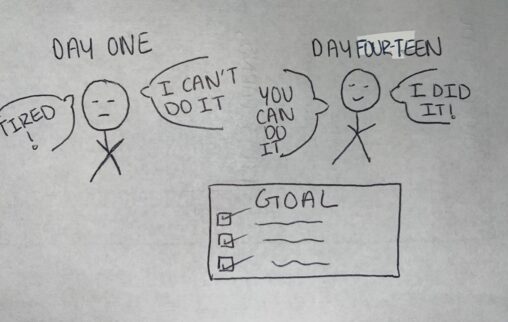
– in my comic it shows that the first figure on the very first day does not look happy as the figure also demonstrates a graph, there were…
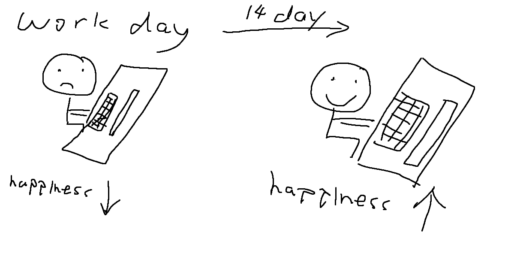
Before I say thanks you plan, my happiness always disappears when I work. The work is sad and boring. After 14 days of the plan, I enjoy working,…
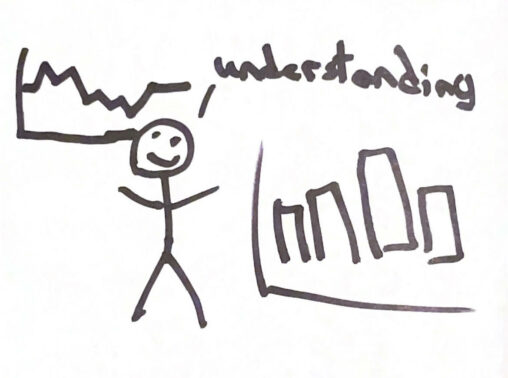
I’m comparing where I started with this project and how far I’ve gotten. I’ve realized who much I’ve accomplished. The smile on my face represents my satisfaction with…
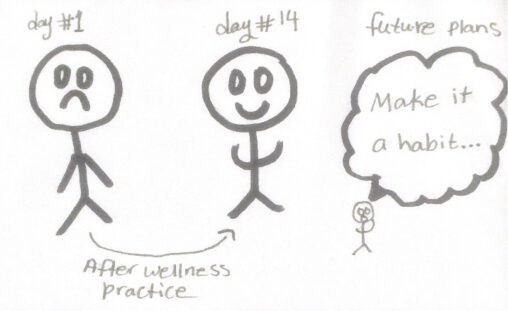
I was sad and confused on the first day of the activity. I wasn’t confident about the activity’s effectiveness (first stage, the past stage). However, after doing my…
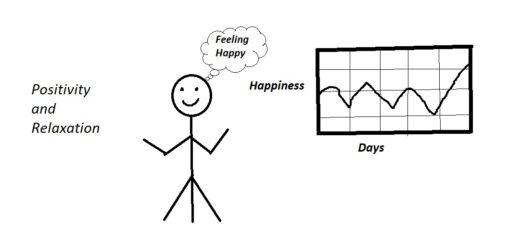
My comic shows that my hard work along with sincere efforts and motivation brings me positive results. In my graph, happiness level shows an increasing trend, thus reducing…
after completing research, I used to be happy, stress-free, and less anxious. I used to stay burdened less and enjoy spending time with my friend. Literally, I laugh…
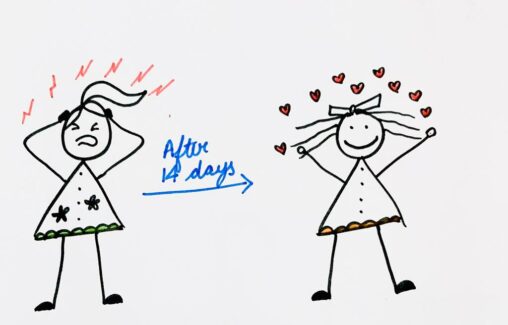
Before starting my wellness practice I use to remain sad and all stressful. I become panicked easily when I face a little problem but somehow I want to…