
88 Comics Categorized "Step #5 – Show me the data! My conclusion is …" (page 1 of 5)
Now that you have attempted/achieved ‘flying’ with your psychological practice, it’s time to show us a stick figure scene of your evidence-based conclusions. What do your 14 days of data — dependent measures (e.g., happiness, productivity, energy) — reveal about the effectiveness of your psychological practice. Note: you may include a cartoon sketch of the graph of your data. You will also submit an APA style graph of your data with your full report.
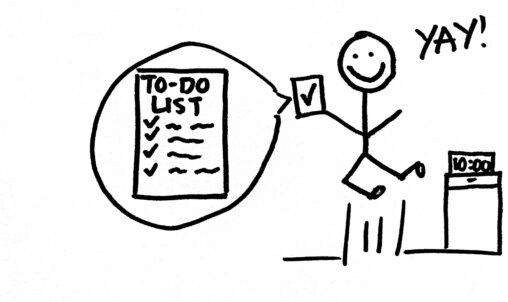
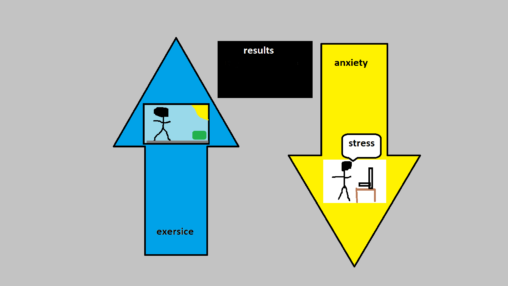
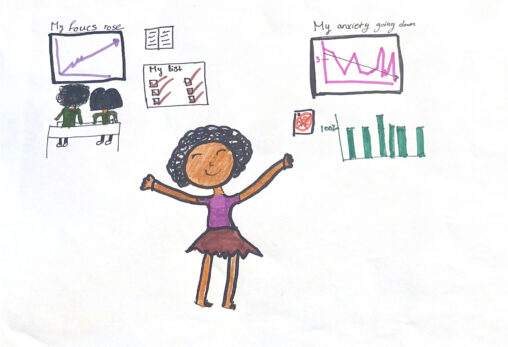
For my data collection, I realized how much waking up earlier to finish all my tasks for the day has greatly improve my anxiety levels throughout the day!…
During the data collection portion, I realized how much reading affected my daily life.
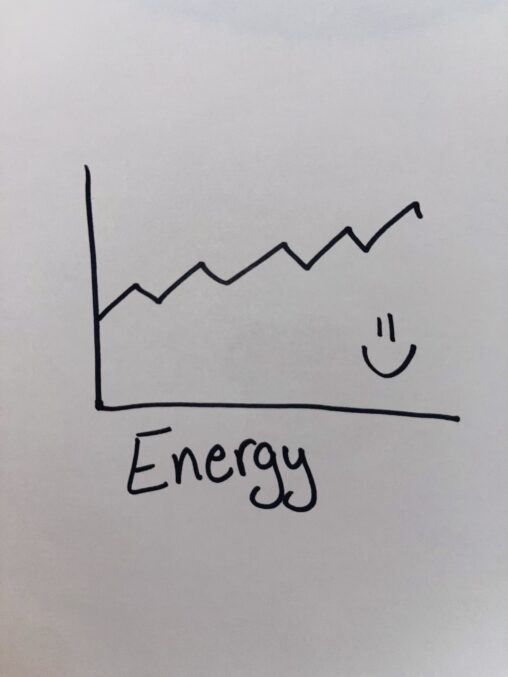
This graph shows how my energy throughout the days of this process slowly went up but still had some times and days where my energy was lower than…
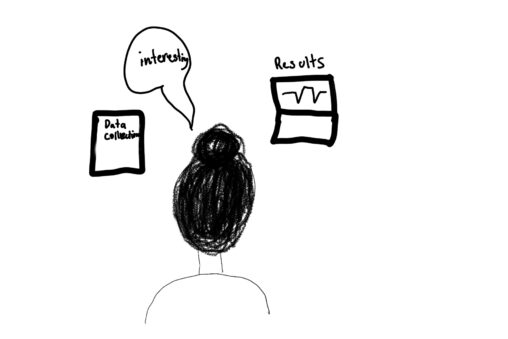
this seen is a slide that shows my results from the wellness practice, this was the best way I could think of to represent my results.
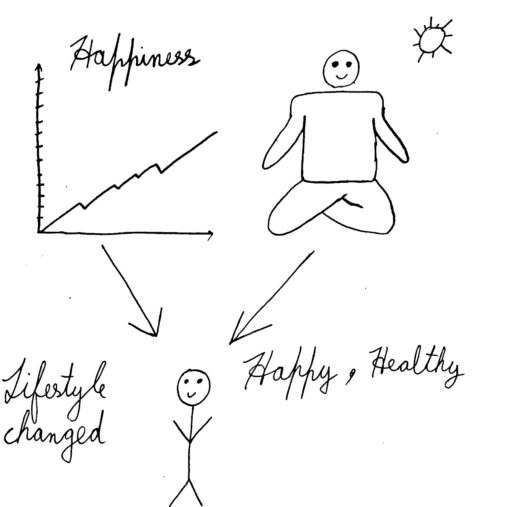
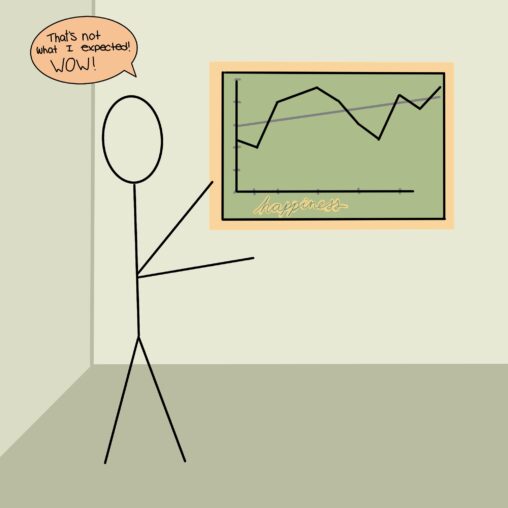
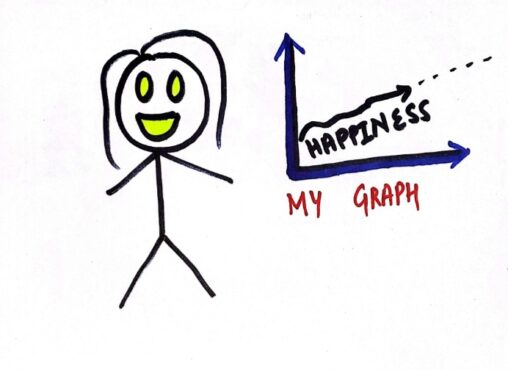
I started meditation in the mornings, and I saw a gradual increase in my graph for happiness. It made my lifestyle more healthy and happy.
My average plan followed was 87.5, and was to measure fatigue, but there were a few days where I didn’t follow it so the graph isn’t perfect. It…
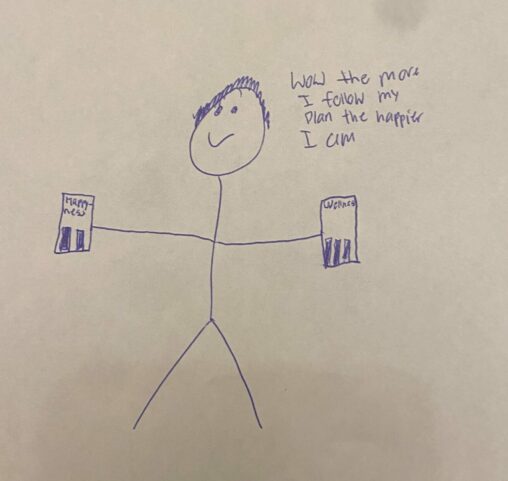
I realized after looking at my data the more progress made on my wellness practice the happier I’ve been and I’m super proud of myself for sticking to…
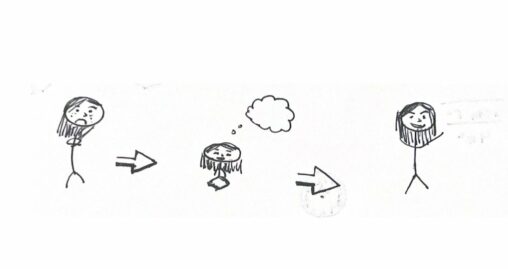
The is a girl who is very anxious and sad which is shown on the left side before the study was taking place. As time progressed and so…
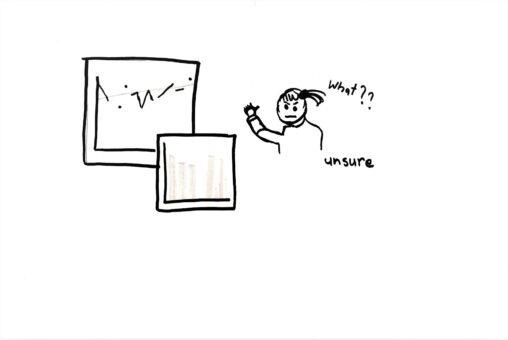
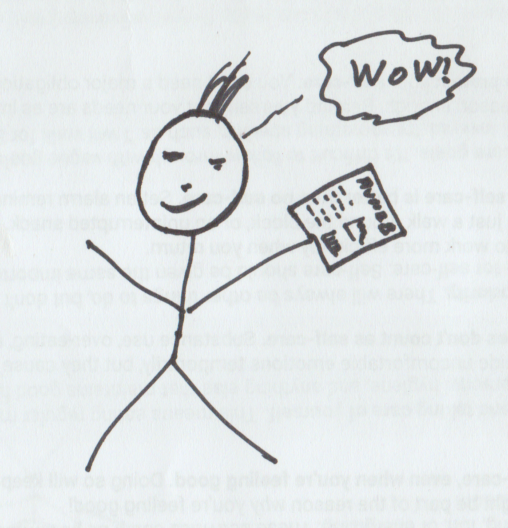
My data was a surprise to me. I thought that I wouldn’t see much of a difference, if anything I would see a decrease in my happiness, but…
my result was quite satisfying. I had a gradual increase on my happiness graph. On seeing the graph , it is clear that in the first week of…
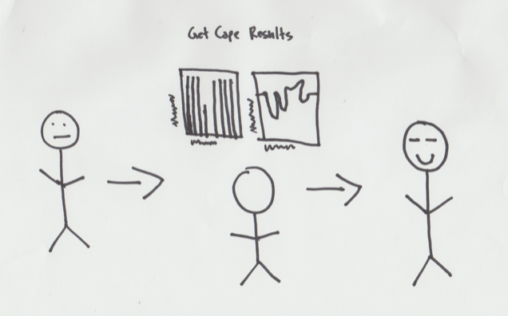
It is a stick figure of me watching at my Get Cape data and happy after seeing my anxiety graph is decreased.
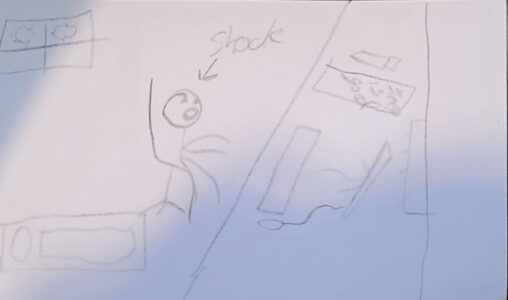
In my comic I am sitting in front of my computer screen in shock. After learning the total of my graphs I didn’t know how important sleep is….
In my comic, there is me before I start meditating and I look okay with how I am doing. Then the next picture is me looking at my…
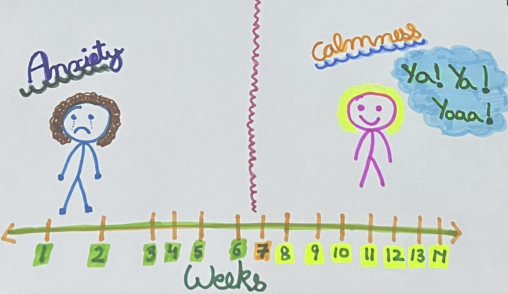
Its showing that the person is following some steps to change the anxiety to calmness in 14 days to have a good life. Also to have anxiety free…
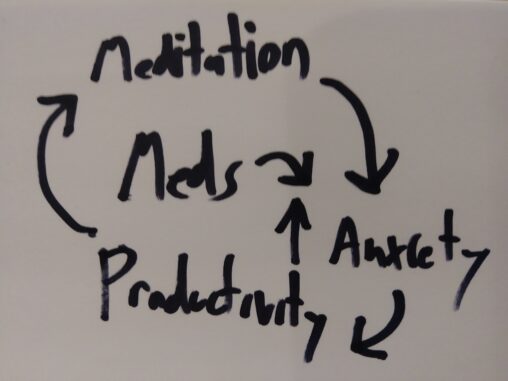
A circle depicting the variables Meds (Medication) and meditation both reinforcing better anxiety, which reinforces productivity, which encourages meditation.
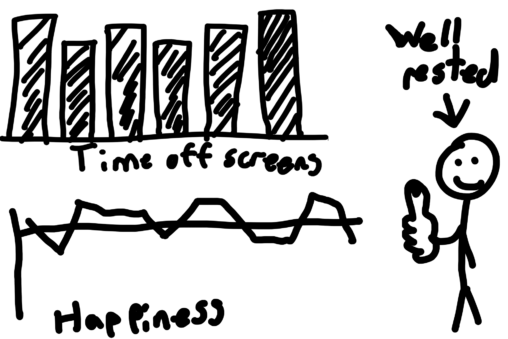
After finishing the practice I am quite pleased. Though I did not find a completely direct relation between my screen time and my happiness, what the practice did…
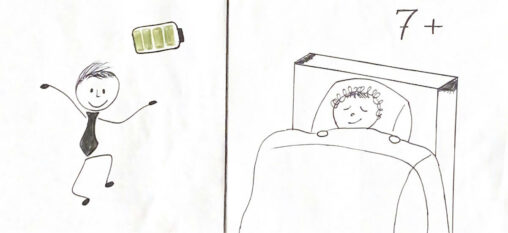
In my comic there is to picture that is indicating the more i sleep if it is 7 hours or more then the more energized i would be…
Before I felt In this experience, I thought it was difficult to turn off my phone, but I committed because it is a school assignment, and this helped…
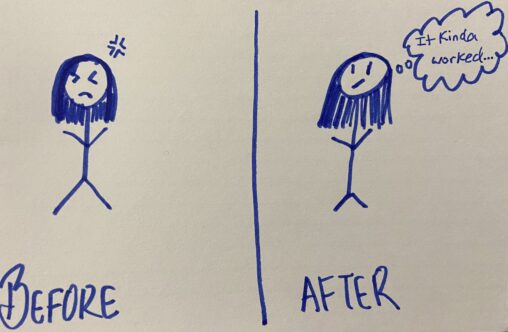
The stick figure on the left represents me before the experiment feeling anxious. The stick figure on the right represents me after the experiment not really sure if…

I started meditation in the mornings, and I saw a gradual increase in my graph for happiness. It made my lifestyle more healthy and happy.