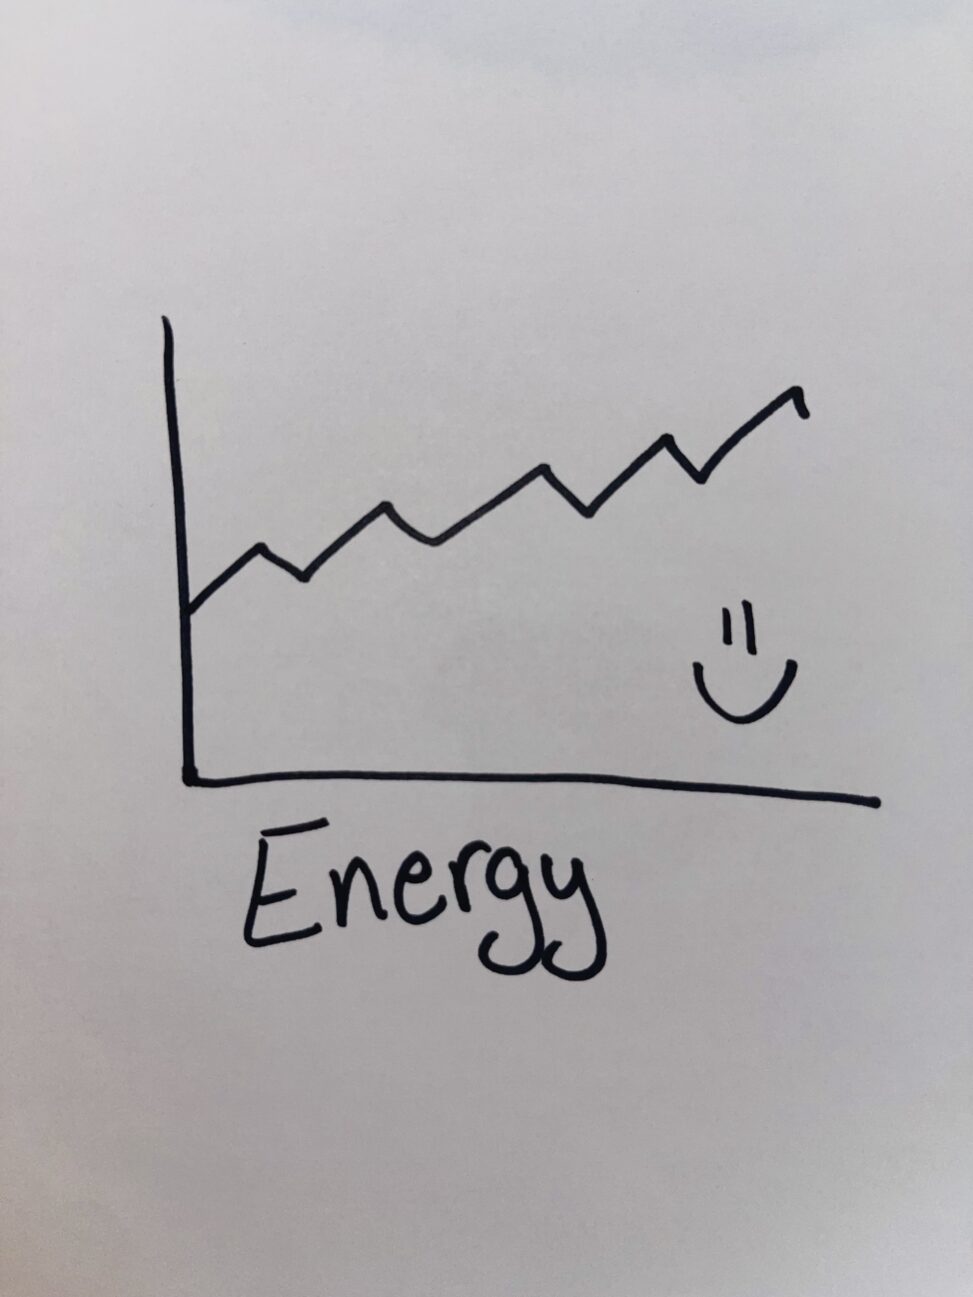
This graph shows how my energy throughout the days of this process slowly went up but still had some times and days where my energy was lower than others. However compared to before the start of this process my energy is much higher overall.
 Get cape. Wear cape. Fly. Spring 2022
A SPLOT on the Web: Get cape. Wear cape. Fly. Spring 2022.
Blame @cogdog for the TRU Collector Theme, based on Fukasawa by Anders Norén.
This graph shows how my energy throughout the days of this process slowly went up but still had some times and days where my energy was lower than others. However compared to before the start of this process my energy is much higher overall.
Appreciate the awesomeness! Comments
Please comment on two peers' comics for every one post of yours.