
88 Comics Categorized "Step #5 – Show me the data! My conclusion is …" (page 4 of 5)
Now that you have attempted/achieved ‘flying’ with your psychological practice, it’s time to show us a stick figure scene of your evidence-based conclusions. What do your 14 days of data — dependent measures (e.g., happiness, productivity, energy) — reveal about the effectiveness of your psychological practice. Note: you may include a cartoon sketch of the graph of your data. You will also submit an APA style graph of your data with your full report.
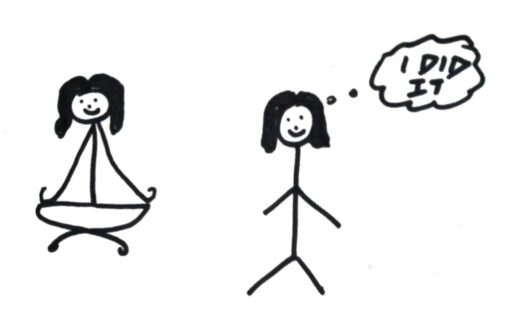
I have received my results and I am happy with what I got. My score was higher than expected. I was able to complete my full workout and…
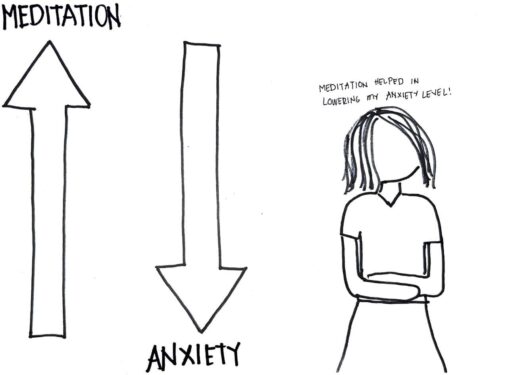
My 14-day study about the effect of meditation on my anxiety level was superb. With being consistent and committed, I got a significant result which is meditation helped…
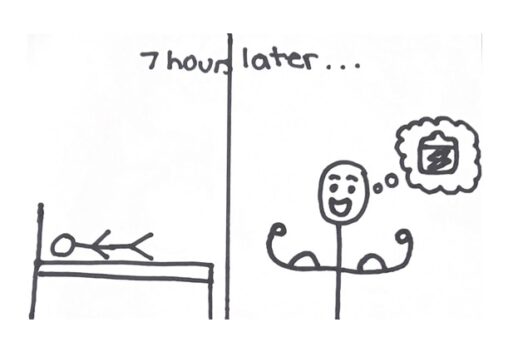
During my Get cape study, I managed to maintain at least 7 hours of sleep for most nights which allowed me to have more energy when I woke…
This is the result that problems were very less but results are much better and more than the problems. Thus it demonstrates that one good thing will lead…
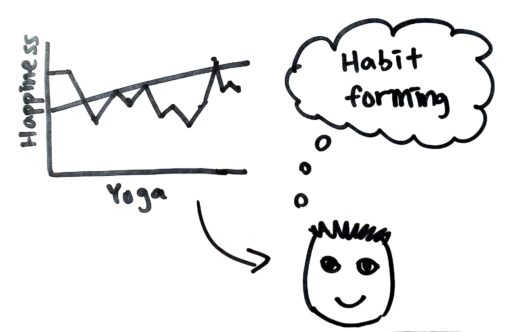
My research result showed that there is a positive correlation between daily yoga practice and my happiness level. Therefore, I envision that I would integrate my wellness practice…
i completed my wellness practice of doing yoga and i am very happy with the results i got. looking at the data, i noticed that i felt more…
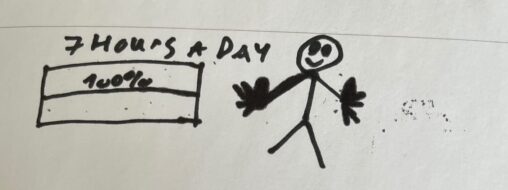
I was really happy after completing my wellness practice because I was able to complete my goal every day to sleep 7 hours a day. All this data…
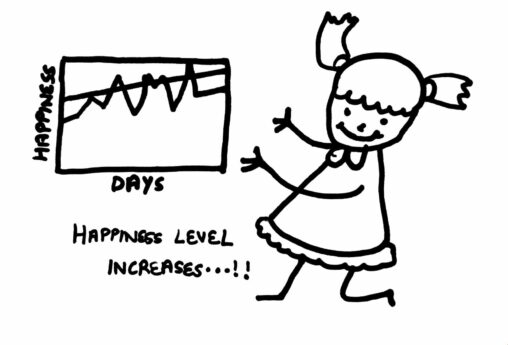
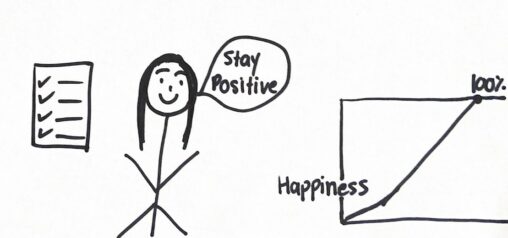
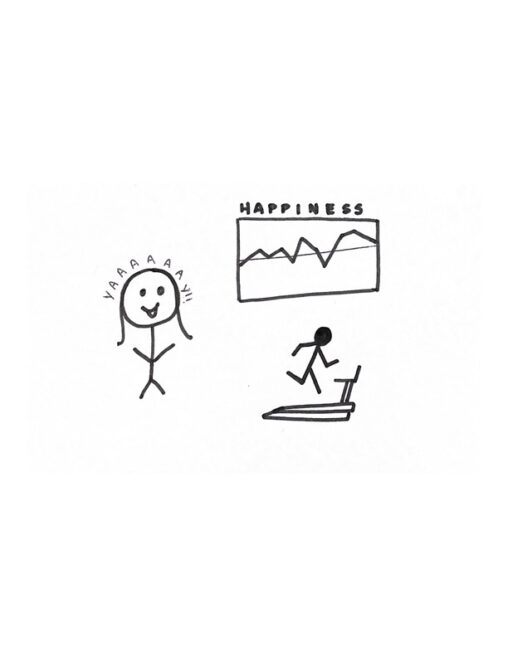
In this comix, stick figure girl (me) looking at the line graph which illustrates that meditation increases happiness. After completing my research I conclude that meditation is really…
In this comic, I drew myself smiling since my happiness level went up. I found myself being happier and more productive on the days I went to the…
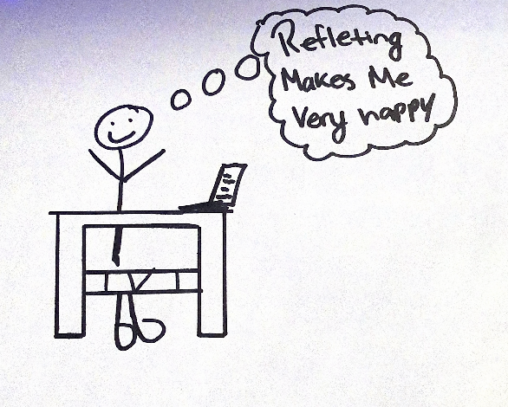
In this comic I have drawn myself reflecting on how my happiness is boosted as i reflect on my 5 positives of a day. Making me able to…
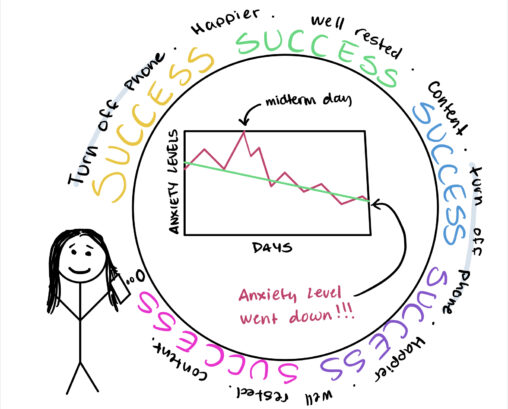
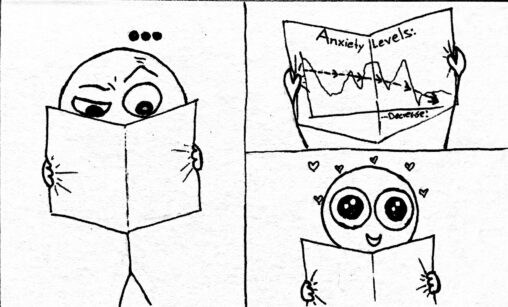
In this comic, you see a stick figure (me) reflecting on her measured anxiety levels that were collected over the span of 14 days. I turned my phone…
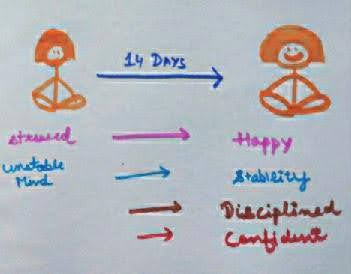
As a person preoccupied with anxiety, this journey has helped me develop a healthy coping strategy to manage my stress. After achieving the wellness project’s goal, I learn…
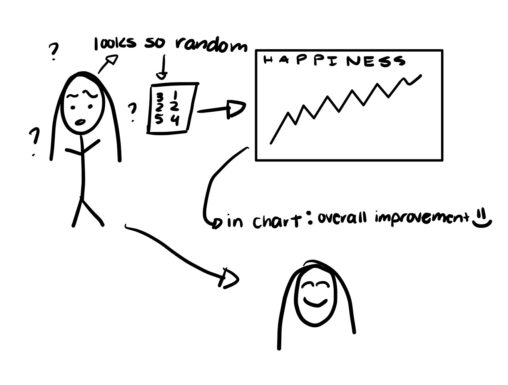
At first, just looking at my data, I thought my numbers were so random that my results wouldn’t say that my happiness improved. After plugging in all the…
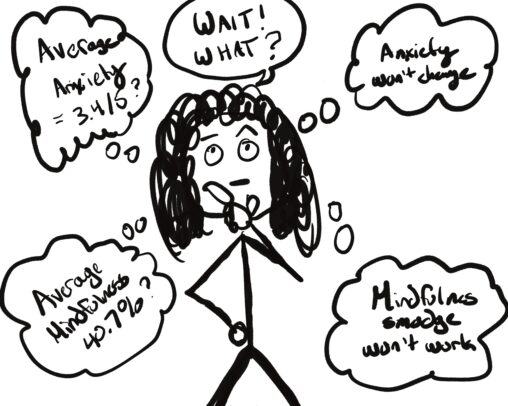
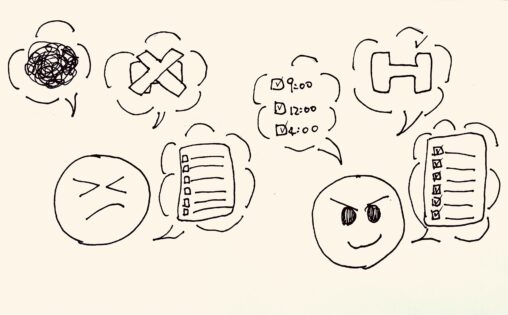
Here I am contemplating my first thoughts along with my end result thoughts. Thinking that things won’t work out and then finding out that things worked out better…
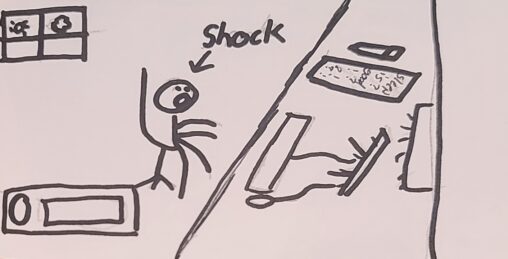
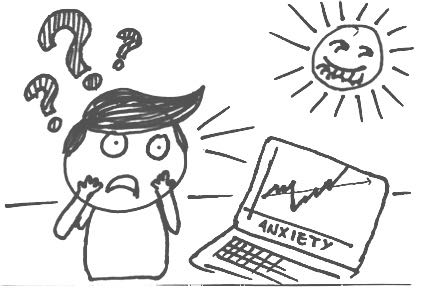
In my comic I am sitting in front of my computer screen in shock. After learning the total of my graphs I didn’t know how important sleep is….
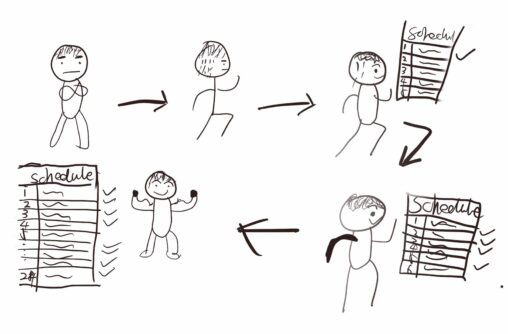
Running for half an hour every day and making a schedule regular running has changed me from anxious to calm. I feel more fulfilled every day and feel…
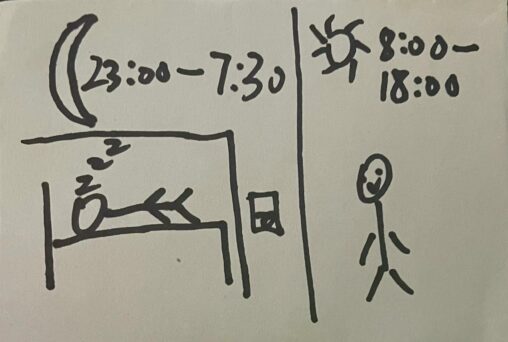
The result I got in this research is that sleeping longer can make me feel better during the day. Before the study I slept very little every day,…
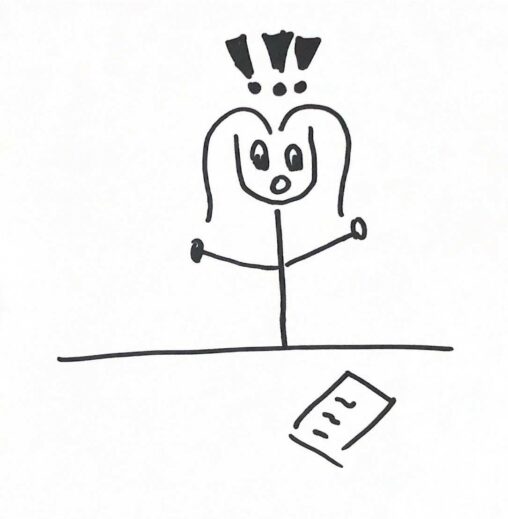
Before doing this, I thought that I will have a low result, but I was shock because there were days that my result is high and I actually…
When I was preparing to analyze the data I had collected, I wasn’t quite sure what I was expecting to discover in the results. It turns out that…
Oh no! This wasn’t what I was expecting! My anxiety levels should have gone down and they went up instead. Maybe it is because progressive muscle relaxation therapy…