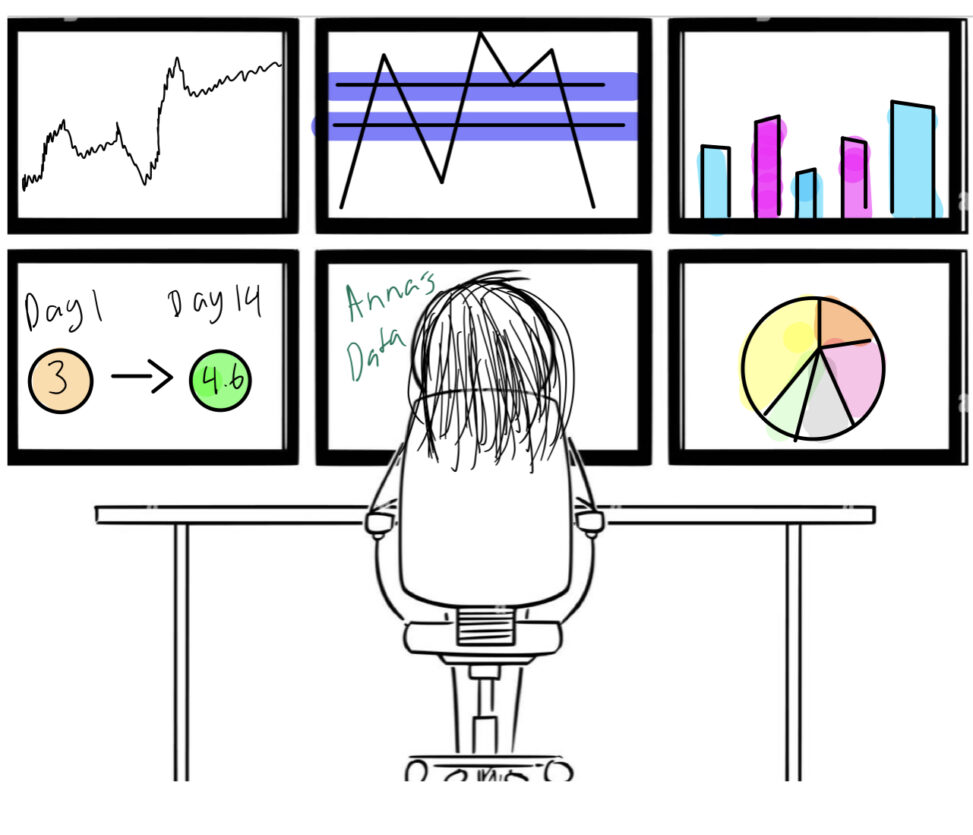
To conclude my “get cape wear cape” project I am sitting in front of a desk staring at six monitors that contain data about my findings as I conducted this experiment. I am looking at this data carefully to identify trends or patterns in my data.
 Get cape. Wear cape. Fly. Spring 2022
703 total comics collected
A SPLOT on the Web: Get cape. Wear cape. Fly. Spring 2022.
Blame @cogdog for the TRU Collector Theme, based on Fukasawa by Anders Norén.
Joey Tirona
Your drawing looks great! I like how you drew out all the charts and coloured them
Bochen Li
This comic is so good!Through your comics, everything becomes better for you,hope you get better.
AALIYAH
GREAT DETAIL IN YOUR PICTURE AND IT LOOKS SO PERFECT GREAT WORK!
Anthony Johnson
Wow! Amazing job with your detail here! Your comic is very pleasing to the eye. I am glad that you have been able to successfully view your obtained information
Lovepreet Kaur
The dedication and efforts that you have put in are quite noticeable both in your results as well as in your comic.