Step #5 – Show me the Data!

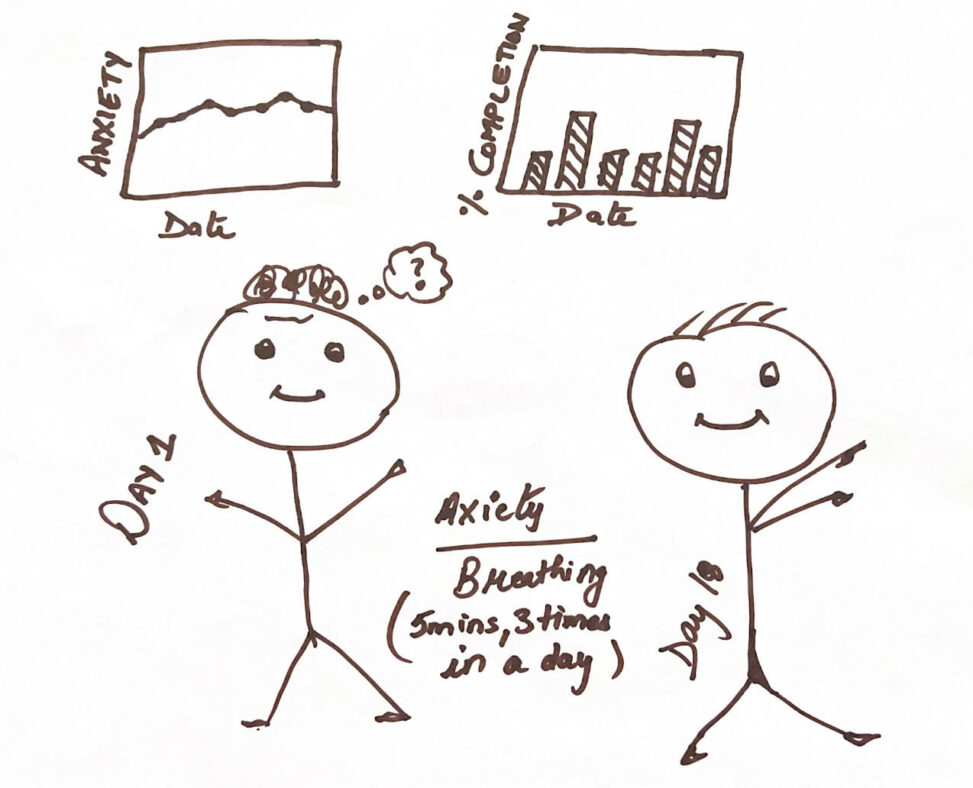
The comic depicts a graph of recorded data for 18 days and the stick figures are showing the difference in mood over time.

Who is sharing this comic? Author?: KPU12.GAGAG
Image Alt Text - Say what can be seen: There is collected data shown shown in two different graphs of wellness practice to reduce the anxiety. The first stick figure person visualizes me confused because of anxiety. After doing the wellness practice which was breathing for 5 minutes three times a day for 18 days did not make remarkable difference in my anxiety level may be because I did not choose effective practice. But I\'m still feeling little better as compare to earlier condition.

Edit Link: (emailed to author)
Request Now

← Previous comic

Next comic →

2 Comments

  1. It is really good to know you felt better after the project work. Keep up the spirits!

  2. Damanjit Singh Bajwa

    I like your comic and the way you have defined it.

Appreciate the awesomeness! Comments

Please comment on two peers' comics for every one post of yours.

Your email address will not be published. Required fields are marked *