
The data research is now complete, since it has been 14 days.
Overall, I think I made some good progress, but I feel like I could have done better, especially with my time consistency if I had planned it out better.
Looking at the data of my average anxiety, it is very pleasing and I also get the feeling of satisfaction seeing a decline in my anxiety overall from the 8th to the 22nd of February.
Other than that, this was the first time I did a research project like this, which was an interesting experience, and I plan on continuing this practice.
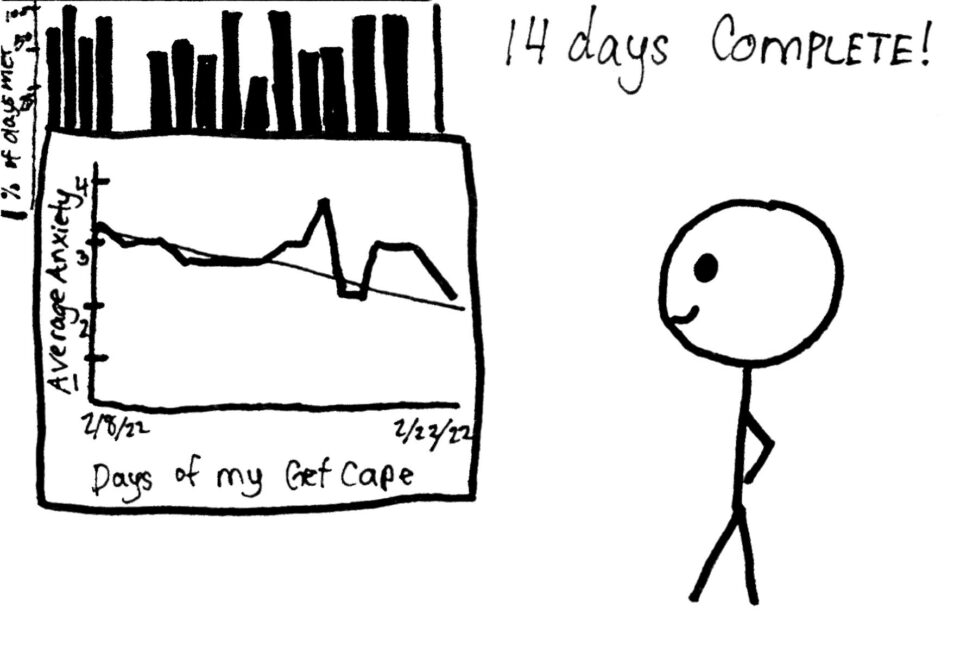
Step 5 – Show Me the Data! My Conclusion is…
Appreciate the awesomeness! Comments for aaron birring Cancel reply
Please comment on two peers' comics for every one post of yours.
lakshay
It looks so good with your graphs and statistical data , Amazing work!!
aaron birring
The way you explained your experience and situation was really immersive i loved the words you used made me feel as if i was not only reading but apart of your study as well. You did an overall great job, and i love the graphs you drew. I hope you well with continuing the practice that is something we both will share in common. Keep up the good work and nice drawings :).
chandanpreet kaur
you had express you feelings in a nice way both in words and figure.i hope you can do it .